The lab report below was submitted as part of the coursework for
CM3292 Advanced Experiements in Analytical and Physical Chemistry. Please do not plagiarise from it as
plagiarism might land you into trouble with your university. Do note
that my report is well-circulated online and many of my juniors have
received soft copies of it. Hence, please exercise prudence while
referring to it and, if necessary, cite this webpage.

AIMS
(A) To determine the excitation and emission spectra of quinine sulfate solution
(B) To determine the concentration of an unknown quinine solution using a calibration graph
(C) To investigate the concentration effect on quenching of fluorescence
(D) To investigate the pH dependence of quinine sulfate
RESULTS and CALCULATIONS
(A) To determine the excitation and emission spectra of quinine sulfate solution
To dilute 25 mg of quinine in 1 L of 0.1M H2SO4 (25ppm) to 0.5ppm, use
M1V1 = M2V2, where M1V1 is the molarity and volume of the initial solution and M2V2 is the molarity and volume of the final or wanted solution,
(25) V1 = (0.5) (25) and V1 = 0.5 ml
The same calculation was applied to determine the volume of stock solution required to prepare other concentrations of solutions.
From the excitation spectrum, the wavelength at which maximum intensity is obtained is 347.73nm.
From the emission spectrum, the wavelength at which there is maximum fluorescence is 447.07nm.
From the emission spectrum, the wavelength at which there is maximum fluorescence is 447.07nm.
(B) Determine the concentration of an unknown quinine solution
A calibration graph was established using the intensity of fluorescence at different concentrations:
Standard Solution
|
Concentration (ppm)
|
Fluorescence Intensity
|
1
|
0.5
|
14.779
|
2
|
1.0
|
29.913
|
3
|
1.5
|
42.406
|
4
|
2.0
|
56.646
|
5
|
2.5
|
69.748
|
Table 1 – Results for fluorescence Intensity at different concentrations
The equation of the best-fit line is determined to be y = 27.33x + 1.697
The fluorescence intensity of the unknown quinine solution was found to be 32.294.
Using the equation, the concentration of quinine in the unknown solution is determined to be 1.120ppm.
The fluorescence intensity of the unknown quinine solution was found to be 32.294.
Using the equation, the concentration of quinine in the unknown solution is determined to be 1.120ppm.
(C) To investigate the concentration effect on quenching of fluorescence
Standard Solution
|
Concentration (ppm)
|
Fluorescence Intensity
|
1
|
5.0
|
128.905
|
2
|
10.0
|
214.322
|
3
|
15.0
|
273.614
|
4
|
20.0
|
317.184
|
5
|
25.0
|
345.349
|
Table 2 – Results for fluorescence intensity at higher concentrations
As compared to Figure 1, Figure 2 is a curve instead of a straight line. The graph shows that the flourescence intensity does not vary proportionally at higher quinine concentrations. Instead, the intensity increases at a decreasing rate. A maximum intensity may be reached eventually.
(D) To investigate the pH dependence of quinine sulfate
Standard Solution
|
Exact pH
|
Fluorescence Intensity
|
1
|
2.69
|
5.425
|
2
|
3.03
|
7.135
|
3
|
3.65
|
8.681
|
4
|
3.93
|
10.068
|
5
|
4.52
|
5.653
|
6
|
5.01
|
3.342
|
Table 3 – Results for fluorescence intensity at different pH
From the plot above, to obtain the pH which gives the highest fluorescence intensity, we differentiate the equation, y = -3.601 x2 + 26.71 x – 40.48,
dy/dx = - 7.202 x + 26.71
At the highest relative fluorescence light intensity, dy/dx = 0 and x = 3.708 ≈ 3.71
Hence, the pH that gives the highest fluorescence intensity is about 3.71.
DISCUSSION
Fluorescence
Fluorescence is the emission of a photon at a longer wavelength than that of the photon absorbed. At room temperature, most molecules occupy the lowest vibrational level of the ground electronic state. When light is absorbed, molecules will be excited to a higher energy level. Collisions with other molecules will lead to a loss in vibrational energy of the excited molecules until it reaches the lowest vibrational state of the excited electronic state. However, as molecules are rather unstable in the excited state, they will relax to one of the various vibrational levels of the ground electronic state by emitting a photon each. This process is known as fluorescence.
As molecules could drop down into any of the several vibrational levels in the ground state, the emitted photons will be of different energies and frequencies. Therefore, by analysing the different frequencies of light emitted in fluorescent spectroscopy, along with their relative intensities, structures of the different vibrational levels can be determined.
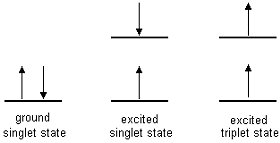
Most compounds do not fluoresce even though all absorbing molecules have the potential to do so. This is because they can undergo other forms of non-radiative relaxation that is occurring at a greater rate as compared to fluorescence emission. After excitation, electrons will drop to the lowest vibrational energy level at that state by vibrational relaxation, which could possibly arise due to collisions between excited molecules and the solvent molecules. Besides fluorescence, electrons can also return to the ground state through other pathways, such as non-radiative internal and external conversion or intersystem crossing followed by phosphorescence (Fig. 4). Internal conversion and vibrational relaxation usually occurs much faster as compared to fluorescence, hence if the molecule undergo such energy conversion pathway, we can almost expect to see no fluorescence process.
Internal conversion is a process where the electronic energy is converted to the vibrational energy of the fluorophore itself. Since vibrational processes are driven by thermal processes, the internal conversion rate typically increases with temperature, which accounts for the commonly observed decrease in fluorescence intensity with rising temperature.
Intersystem crossing is a process where fluorescence signal is reduced and phosphorescence is generated. Spin-orbit coupling is a quantum mechanical process that is responsible for intersystem crossing. Intersystem crossing describes the relaxation of the molecule from a singlet excited state to a lower energy, triplet excitation state. Since spin-orbit coupling is a weak effect, the intersystem crossing rate is low. The relaxation from the triplet state to the singlet ground state requires another change of multiplicity. Hence, the decay from the triplet states also has a very low rate.
Fig 4 - Summary of how energy could be lost from an excited molecule
The most intense fluorescence is usually found in compounds that contains aromatic functional groups with low-energy p→p* transitions and have structures that are rigid. The lack of rigidity will lead to an increase in the internal conversion rate, as one part of the molecule can undergo lower frequency vibrations with respect to its other parts. This will then result in some form of energy loss before fluorescence occurs.
The instrumentation in fluorescence spectroscopy is illustrated below. The light from an excitation source passes through a filter or monochromator, and strikes the sample. A proportion of the incident light is absorbed by the sample, and some of the molecules in the sample fluoresce. The fluorescent light is emitted in all directions. Some of this fluorescent light passes through a second filter or monochromator that isolates the fluorescence emission and reaches a detector, which is usually placed at 90° to the incident light beam to minimize the risk of transmitted or reflected incident light reaching the detector.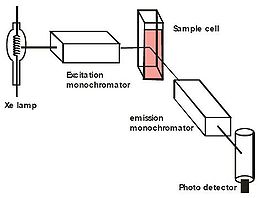
Fluorescence is emitted from the sample in all directions, but it is most accurately measured perpendicularly to the excitation beam. This minimizes the contribution that is a result of scattering and from the intense excitation beam. Hence, the fluorescence cell used to contain the quinine sample has to be transparent on all four sides so that the fluorescence can be measured at right angles to the excitation beam. Since the cell is transparent at all four sides, it is essential to hold it with a tissue paper and clean the surface of the cell to remove any fingerprints on it.
The main advantage of fluorescence detection compared to absorption measurements is the greater sensitivity achievable because the fluorescence signal has a very low background. The measurements of the intensity of fluorescence allow the determination of a variety of important inorganic and organic species in trace amounts. The detection limits are 10 to 100 times lower than those encountered in absorption spectroscopy. Another advantage of fluorescence spectrometry is its large linear concentration ranges which are often greater than those encountered in absorption methods.
Excitation and emission spectra of quinine sulfate solution
The excitation spectrum was obtained by setting the emission monochromator to the wavelength with a maximum response. Referring to the spectrum obtained, it can be seen that quinine has two excitation peaks at 347.73 and 447.81 nm and one emission peak at 447.07 nm. It is noted that the excitation peaks occur at a lower wavelength than the emission peak. By E=hc/λ, a shorter wavelength is at a higher energy. The energy lost could be a result of vibrational relaxation in the form of intermolecular collisions with other molecules before fluorescence occurs. The higher wavelength band around 448.69 nm is most likely responsible for the promotion of an electron from the ground electronic state (S0) to the first excited singlet electronic state (S1) while the lower wavelength band around 343.66 nm should be responsible for the promotion of electron from the ground state to the second excited singlet electronic state (S2).
The fluorescence absorption and emission spectra reflect the vibrational level structures in the ground and the excited electronic states, respectively. The Frank–Condon principle states the fact that the vibrational levels are not significantly altered during electronic transitions. The similarity of the vibrational level structures in the ground and excited electronic states often results in the absorption and emission spectra having mirrored features.
The p→p* transition is expected to be quite low in energy for quinine due to the presence of conjugated aromatic system that lowers the energy gap between the π and π*. Besides, it is also highly rigid in structure. The high fluorescence intensity was likely to be the consequence of symmetry allowed π→π* transitions. The structure of quinine is as shown (below).
Effect of concentration on fluorescence intensity
Figure 1 was obtained using lower concentrations of quinine while figure 2 was obtained using higher concentrations of quinine. However, figure 1 was linear while figure 2 was a curve and thus only the lower concentration quinine solutions could be used to obtain a calibration graph. The fluorescent light intensity increased with increased concentration as more molecules are absorbing in both figures.
For part B of the experiment, a linear calibration plot was obtained in figure 1 and hence the unknown quinine solution can be easily found. From the equation F = P0(2.3εbc)Qfk, it can be seen that the fluorescence intensity is proportional to the concentration of the quinine solution.
In part C of the experiment, the graph obtained (figure 2) is a quadratic plot which is different from part B’s linear plot. At high concentration, the relationship becomes non-linear. This process is known as concentration quenching or inner filter effect where there is a decrease in the fluorescence-per-unit-concentration as the concentration is increased. This is due to an excess absorption of the fluorescent radiation by the solution. Light is not evenly distributed along the path of light at high concentrations. The portion of the solution closest to the light source absorbs most of the radiation, such that there is less available for rest of the solution. Hence, fluorescence is no longer proportional to concentration.
Effect of pH on quinine
Fluorescence intensity of quinine is pH dependent can be shown in figure 3. This is because pH affects the structure of the molecule which indirectly affects the fluorescence intensity. Quinine has two sites (N) of protonation. At low pH, it will exist as a diprotonated molecule. As the pH increases from 2.48 to 3.75, an increase in fluorescence intensity is observed. This is because as the pH increases, there is more quinine molecules in the solution has become monoprotonated. This implies that the monoprotonated form of quinine has a higher fluorescence intensity value than that of the diprotonated form. However, as the pH exceeds 3.75, an increase in pH value leads to a fall in fluorescence Intensity. This is because as the pH increases further, more and more monoprotonated quinine will become totally deprotonated. This implies that the deprotonated form has a lower fluorescence intensity value as compared to the monoprotonated form.
However, to better predict the fluorescence intensity of a fully deprotonated quinine, we could carry out the experiment at pH 14. Maximum fluorescence intensity was observed at around pH 3.71, when all of the quinine molecules exist in the monoprotonated form, since the monoprotonated form gives rise to the highest fluorescence Intensity value as compared to the diprotonated and the fully deprotonated form.
Limitations
Many molecules do not fluoresce because their excited states are quite prone to being deactivated by collisions and other processes. Thus, fluorescence methods are less widely applicable for quantitative analyses than are absorption methods because more species absorb UV/VIS radiation than exhibit fluorescence when radiation is absorbed in the optical region. Also, such deactivation processes can result in severe interference. Molecules that do not exhibit fluorescence need to be converted to fluorescence derivatives in order to be examined by fluorescence.
Precautions
Since the preparation of standards is a crucial step to the results obtained, it must be ensured that the apparatus are properly rinsed with the correct solutions and parallax errors avoided when measuring volumes of solutions.
Also, since the fluorescence sides are all transparent, it is crucial to hold at the sharp sides of the cell to prevent the fingerprints from interfering with the results obtained and hence tissue papers are used to clean the sides before placing into the spectrophotometer for analysis.
CONCLUSION
The maximum emission wavelength is 447.07 nm and the maximum excitation wavelength, is 347.73 nm. From the calibration of fluorescence intensity and concentration of quinine, the concentration of the unknown quinine solution was determined to 1.120 ppm. At high concentration, concentration quenching of fluorescence was illustrated from the deviation from linearity with increasing concentration. The florescence spectrum of quinine is highly dependent on the pH. The pH which gives the highest fluorescence intensity is 3.71.
REFERENCES
[1] Douglas Skoog, James Holler, Stanley Crouch. Principles of Instrumental Analysis, 6th Edition. Belmont: Brooks/Cole, 2004.
[2] Encyclopedia of Life Sciences. Macmillan Publishers, 2002.
[3] Lakowicz, JR. Principles of Fluorescence Spectroscopy. New York: Plenum Press, 1999. Article retrieved on 23 October 2012 from: http://web.mit.edu/solab/Documents/Assets/So-Fluorescence%20spectrophotometry.pdf
[4] UV-Vis Luminescence Spectroscopy. Sheffield Hallam University. Article retrieved on 23 October 2012 from: http://teaching.shu.ac.uk/hwb/chemistry/tutorials/molspec/lumin1.html
hi can I cite this study on our research paper? Please notify me with the names of the authors.
ReplyDelete